Hypoxia in Lake Erie
Introduction.
This is a Web application based on R shiny framework for visualize sensor data of dissolved oxygen (DO) at Lake Erie to estimate hypoxia extent (DO <2mg/L).
Functions
The Web application will able to visualize interactively sensor data from multiple locations in time or spatial dimensions, calculate the sensor correlations, variogram, detect time series outliers, and calculate hypoxia extent using IDW interpolation.
App Snapshots
Due to data policy at current stage, only snapshots are available as:
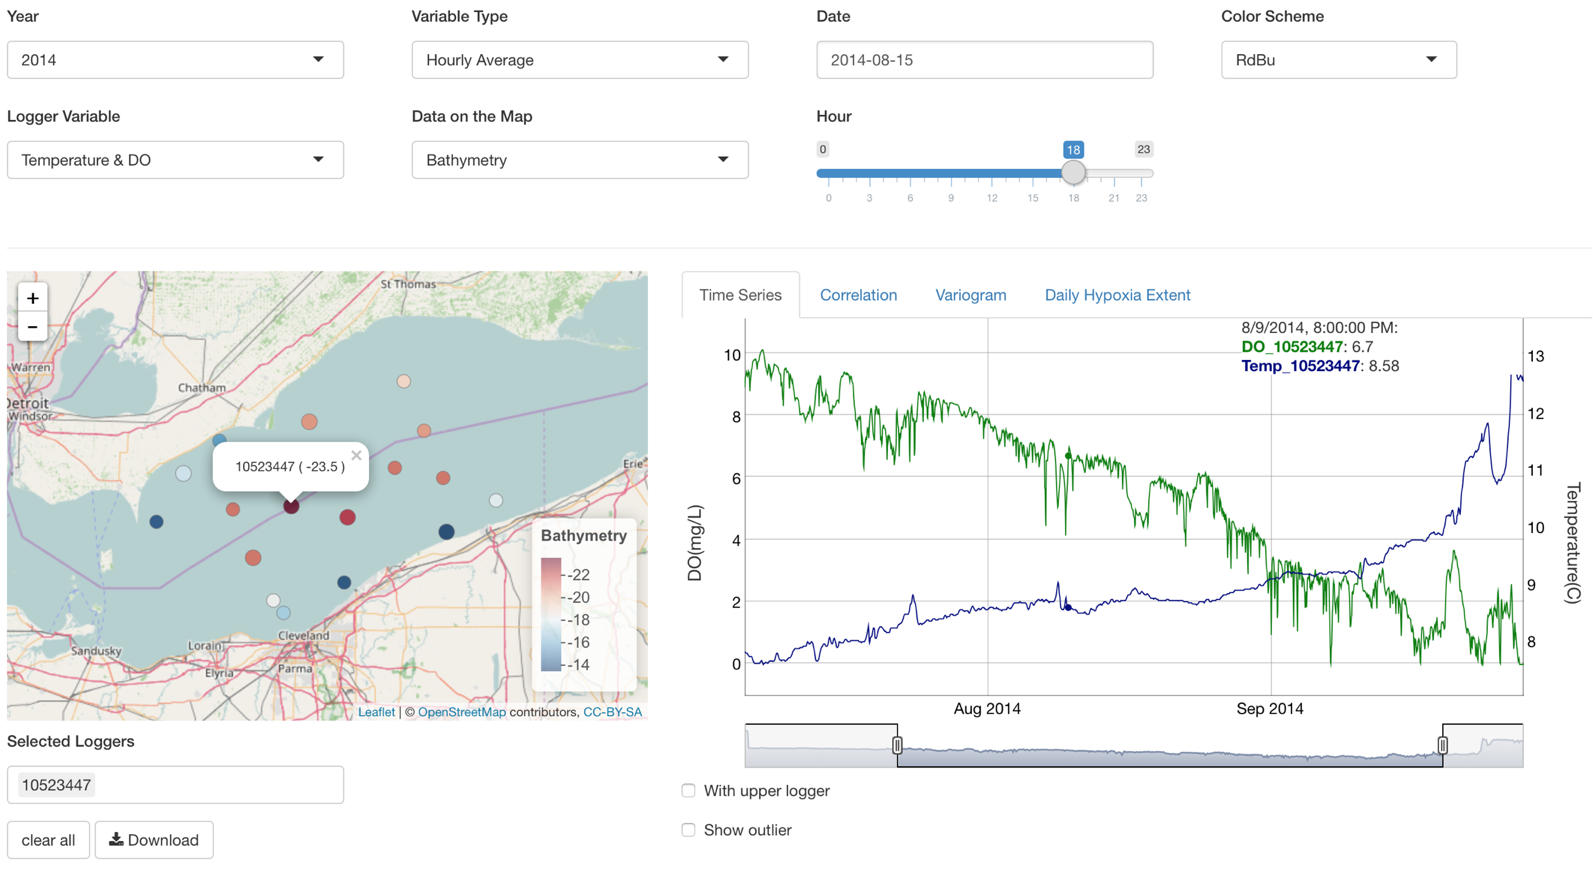
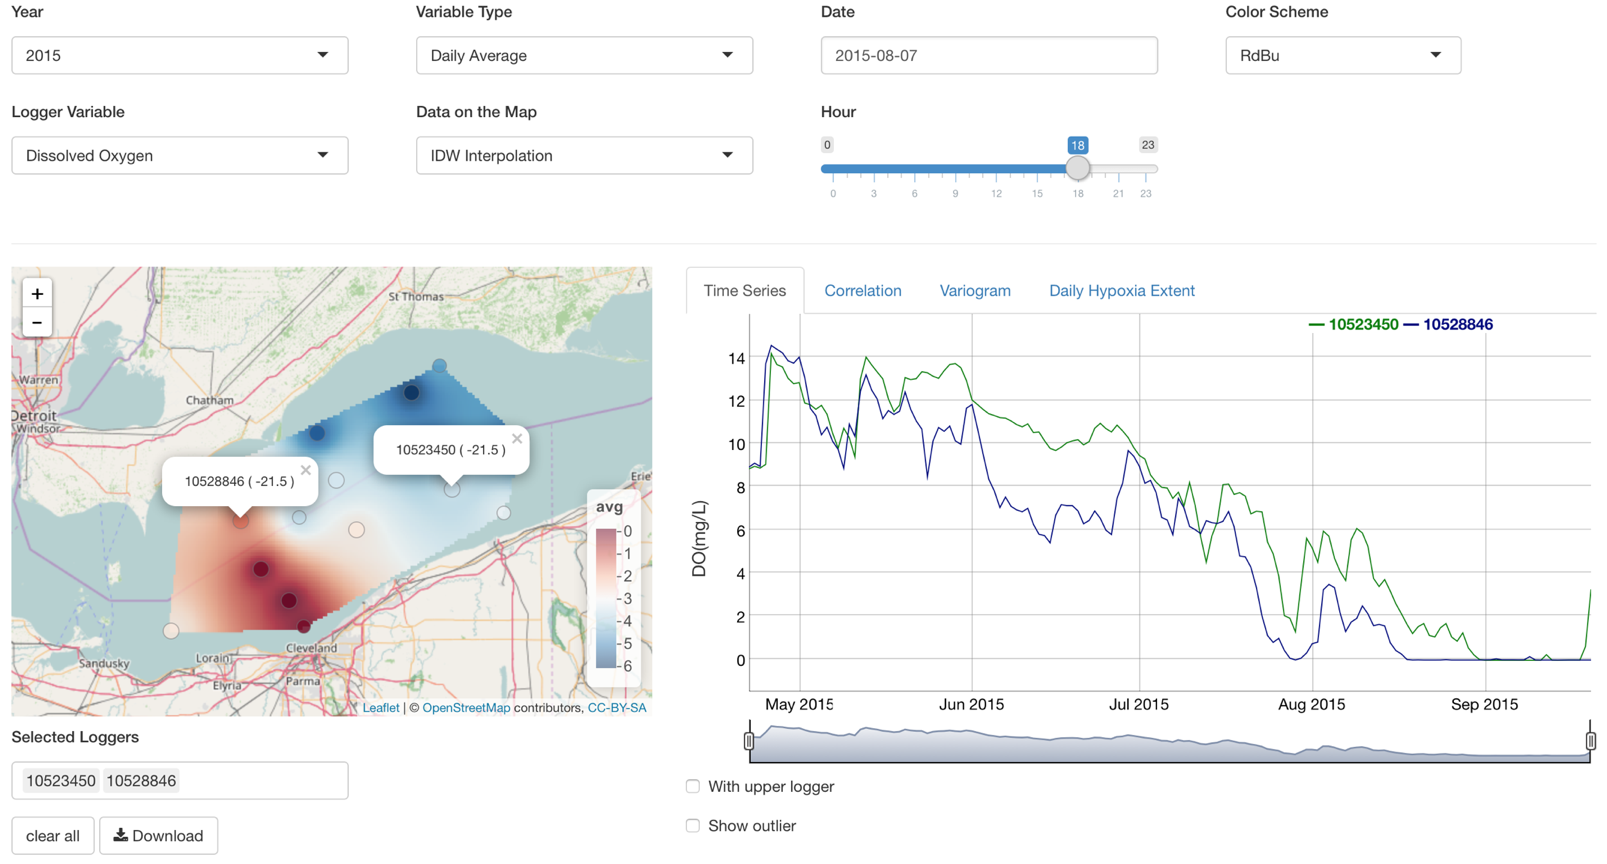
The application is currently hosted in AWS, which connects to AWS RDS. Previously I also used D3 and threeJS to create the visualization