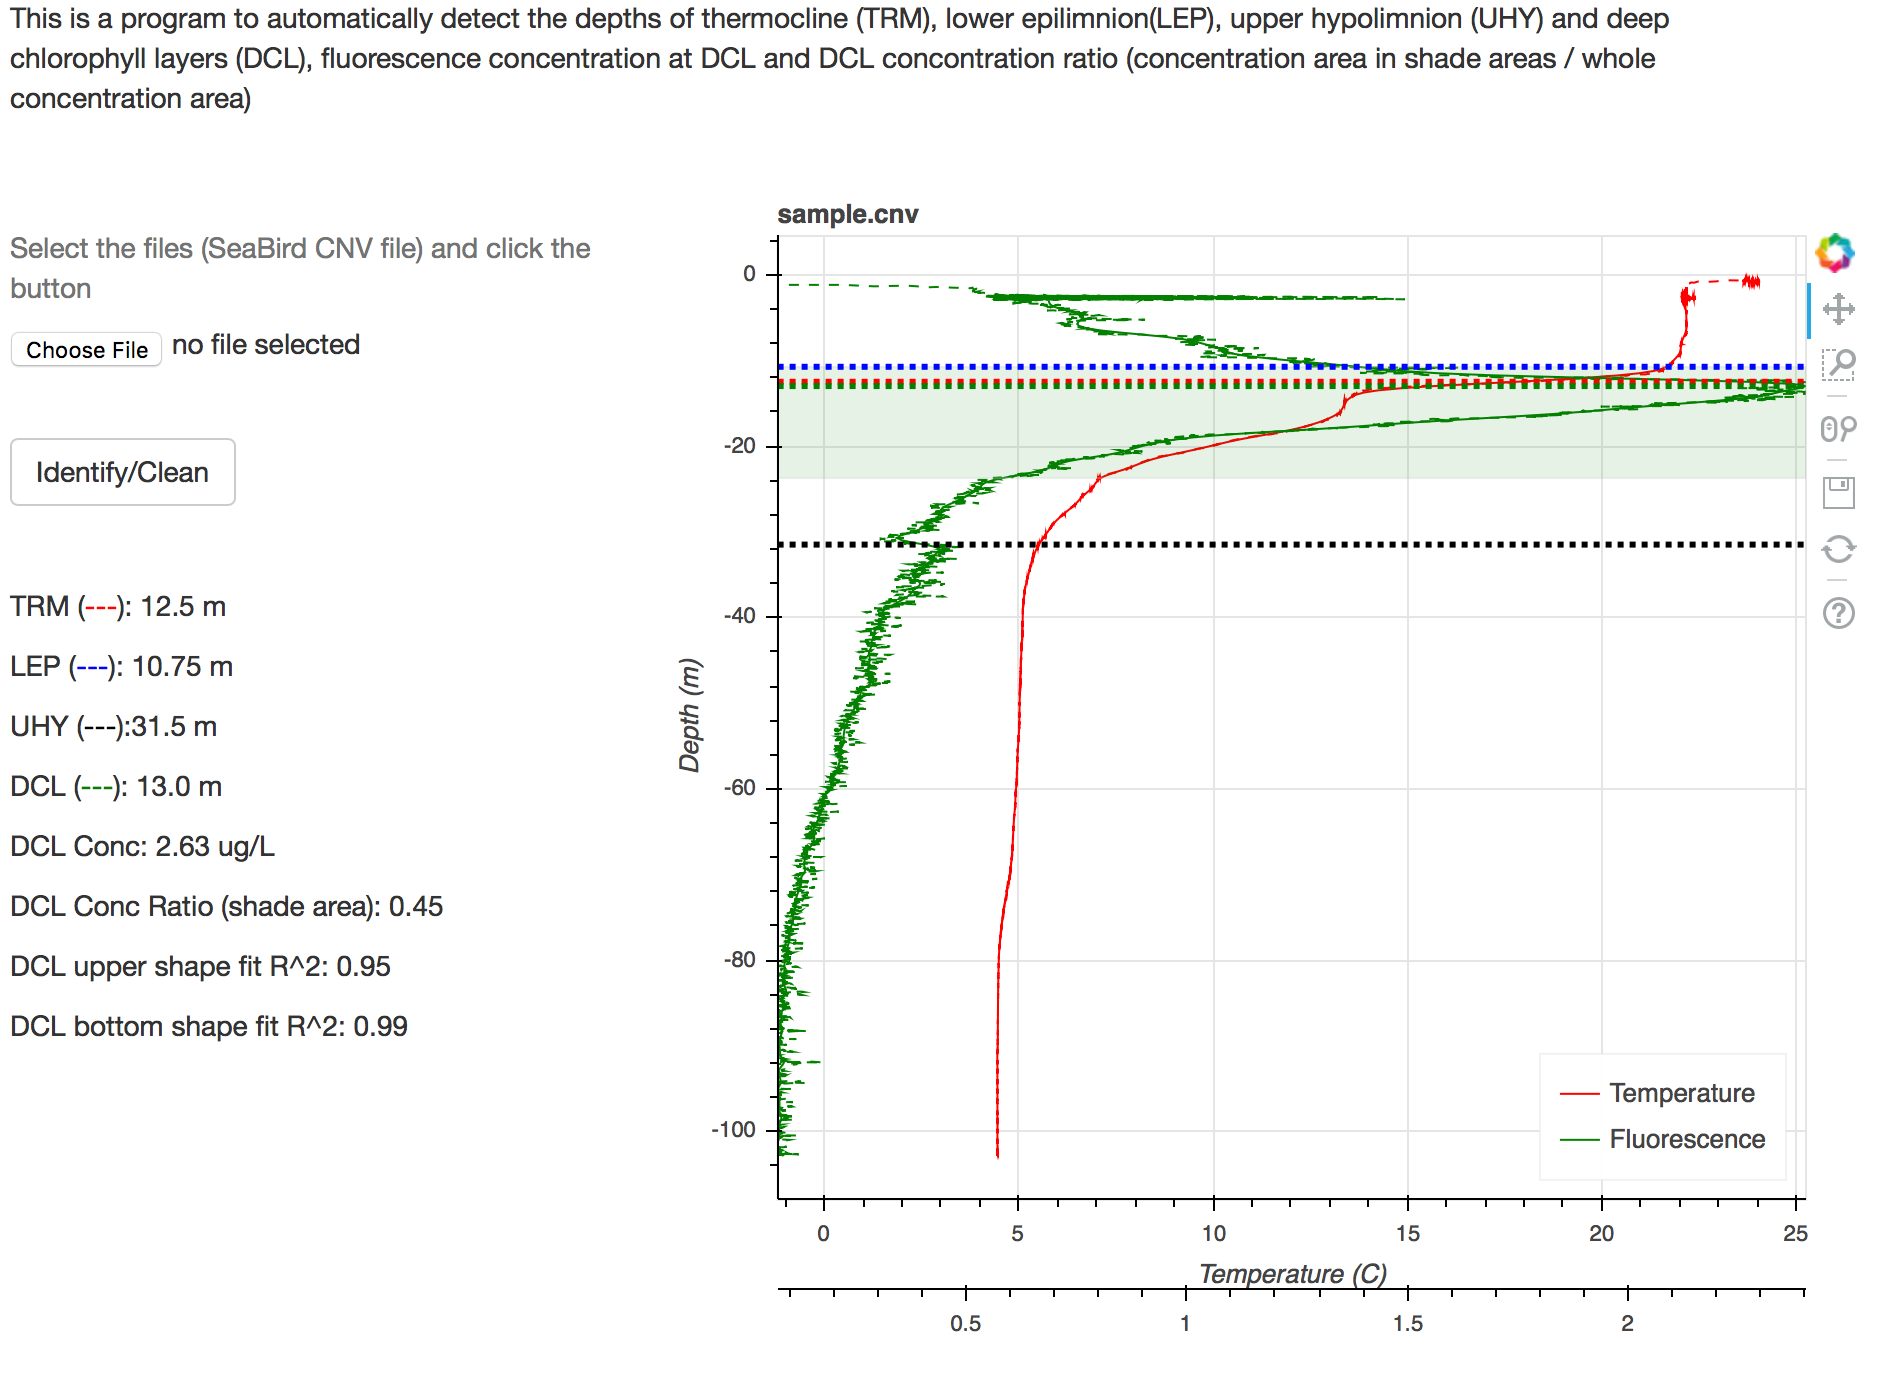
CTD thermocline and DCL automated detector
This folder creates a tool to analyze CTD (conductivity, Temperature, and depth) profilers, specifically for SeaBird CTD profilers.
It can:
- Detect lake stratification (the location of thermocline, epilimnion, hypolimnion) using piecewise linear segmentation (HMM with maximum gradient is currently turned off to save compuation time)
- Detect deep chlorophyll layers by fitting two half gaussian curves on peak points
-
A Flask Python app is available, run
python application.py
To Install: Installl anaconda and bokeh
To use:
from seabird.seabird_class import seabird
import json
import matplotlib.pyplot as plt

config=json.load(open('config.json'))
mySeabird = seabird(config = config)  # config is in json format
filename = "sample.cnv"
mySeabird.loadData(dataFile = filename)  # filename is the cnv file, taking data from database is optional, see the source code
mySeabird.preprocessing()
mySeabird.identify()
features = mySeabird.features  # features are in dictionary format.

print features
The output features are:
DCL features:
- allConc: the sum of Chlorophyll concentration with 0.25m sampling interval
- allConc_upper: the sum of Chlorophyll concentration above LEP, with 0.25m sampling interval
- DCL_upperDepth_fit: the upper boundary of the DCL peak. This value is always deeper than LEP since LEP is used as a threshold to cut.
- DCL_bottomDepth_fit: the lower boundary of the DCL peak
- DCL_upperConc_fit: the concentration at DCL_upperDepth_fit
- DCL_bottomConc_fit: the concentration at DCL_bottomDepth_fit
- DCL_leftSigma: the sigma of the Gaussian shape for upper shape
- DCL_rightSigma: the sigma of the Gaussian shape for lower shape
- DCL_conc: the concentration at the maximum peak
- DCL_depth: the depth with maximum concentration for the DCL peak
- DCL_concProp_fit: the ratio of Chlorophyll in DCL, compared to the whole water column
- DCL_exists: whether DCL exist
-
peakNums: how many significant peak detected
- DCL_leftShapeFitErr: the error of fitting a Gaussian shape for upper DCL part
- DCL_rightShapeFitErr: the error of fitting a Gaussian shape for lower DCL part
Lake Stratification features
- TRM_gradient_segment: the gradient of temperature at TRM (unit C/m)
- TRM_segment: the depth of thermocline using PLR method
- UHY_segment: the depth of upper hypolimnion
- LEP_segment: the depth of the lower epilimion
- doubleTRM: whether double thermocline exist
- positiveGradient: whether abnormal temperatuer increasing with depth exists
- firstSegmentGradient: the gradient of the first segment (C/m)
- lastSegmentGradient: the gradient of the last segment (C/m)
To plot:
mySeabird.plot_all(interestVarList=["Temperature","DO","Specific_Conductivity","Fluorescence","Par"]) # plot the water quality from raw data
mySeabird.plot() # plot the detected depth
plt.show()
File structure:
--Seabird:
	--seabird_class.py: seabird class
	-- deepChlLayers.py: DCL class
	-- thermocline.py: thermocline class
	--tools: contain general file parser, database connection
	--models: Piecewise linear segmentation, HMM and threshold methods.