Welcome to Towed Undulating Vehicles Data Analyzing Tools (TUVtools).
This is a R shiny Web application developed to conduct a near-real-time analysis for water quality data sampled from towed undulating vehicles such as TRIAXUS. The program will automatically interpolate the data, perform hotspot analysis and cluster analysis and then visualize the results in 2D and 3D.
Instruction
Currently the application should be able to run in a local R shiny mode. We provide sample data from Manitowoc site to illustrate how to use the application.The example data can be downloaded here.
After downloading the source code:
- Step 0: Modify config.R and install packages
In config.R, change
config$outputFolder <- "~/Developer/Triaxus/output/"
to your file output folder
config$outputFolder <- $your_output_folder
The analyzed results will be stored in this local folder, and run the following to install packages
install.packages(c("leaflet","ggplot2","sp","gstat","RColorBrewer","rgl","dplyr","ggmap","lubridate","dismo","rglwidget","shiny","reshape2","dygraphs","fields","spdep","pracma"))
To run the app, in R concole, type:
shiny::runApp('src')
- Step 1: Upload the file
In the launched app:
Click "choose File" under Select New File and upload the "Manitowoc_01.csv" downloaded before. The right plot will show the depths of SeaBird Sensors and Fluoroprobe Sensors within the range between "From/To"
If You want to combine the results of "Manitowoc_01" with previous results. Upload the previous results under Select Previous Result File.
- Step 2: Find the index of sensors to align the data
Step 3: Choose the analyzing range
The vechicle may float on the surface thus the data will contains a lot of noise. Choose the data range to remove unwanted part of the data (i.e. the vehicle is actually undulating). For example, choose "From = 800" and "To = 0" (0 or a nubmer larger than the number of data points will be set to the last data point in the app), input the value to the left
Change "From/To" to let the app automatically find a correct set of the Seabird Index and FluoroProbe Index. For example, change "From = 800" and "To = 10000". The red circle in the plot below represents the same valley positions. Input the index in Suggested Anchor Index on the left
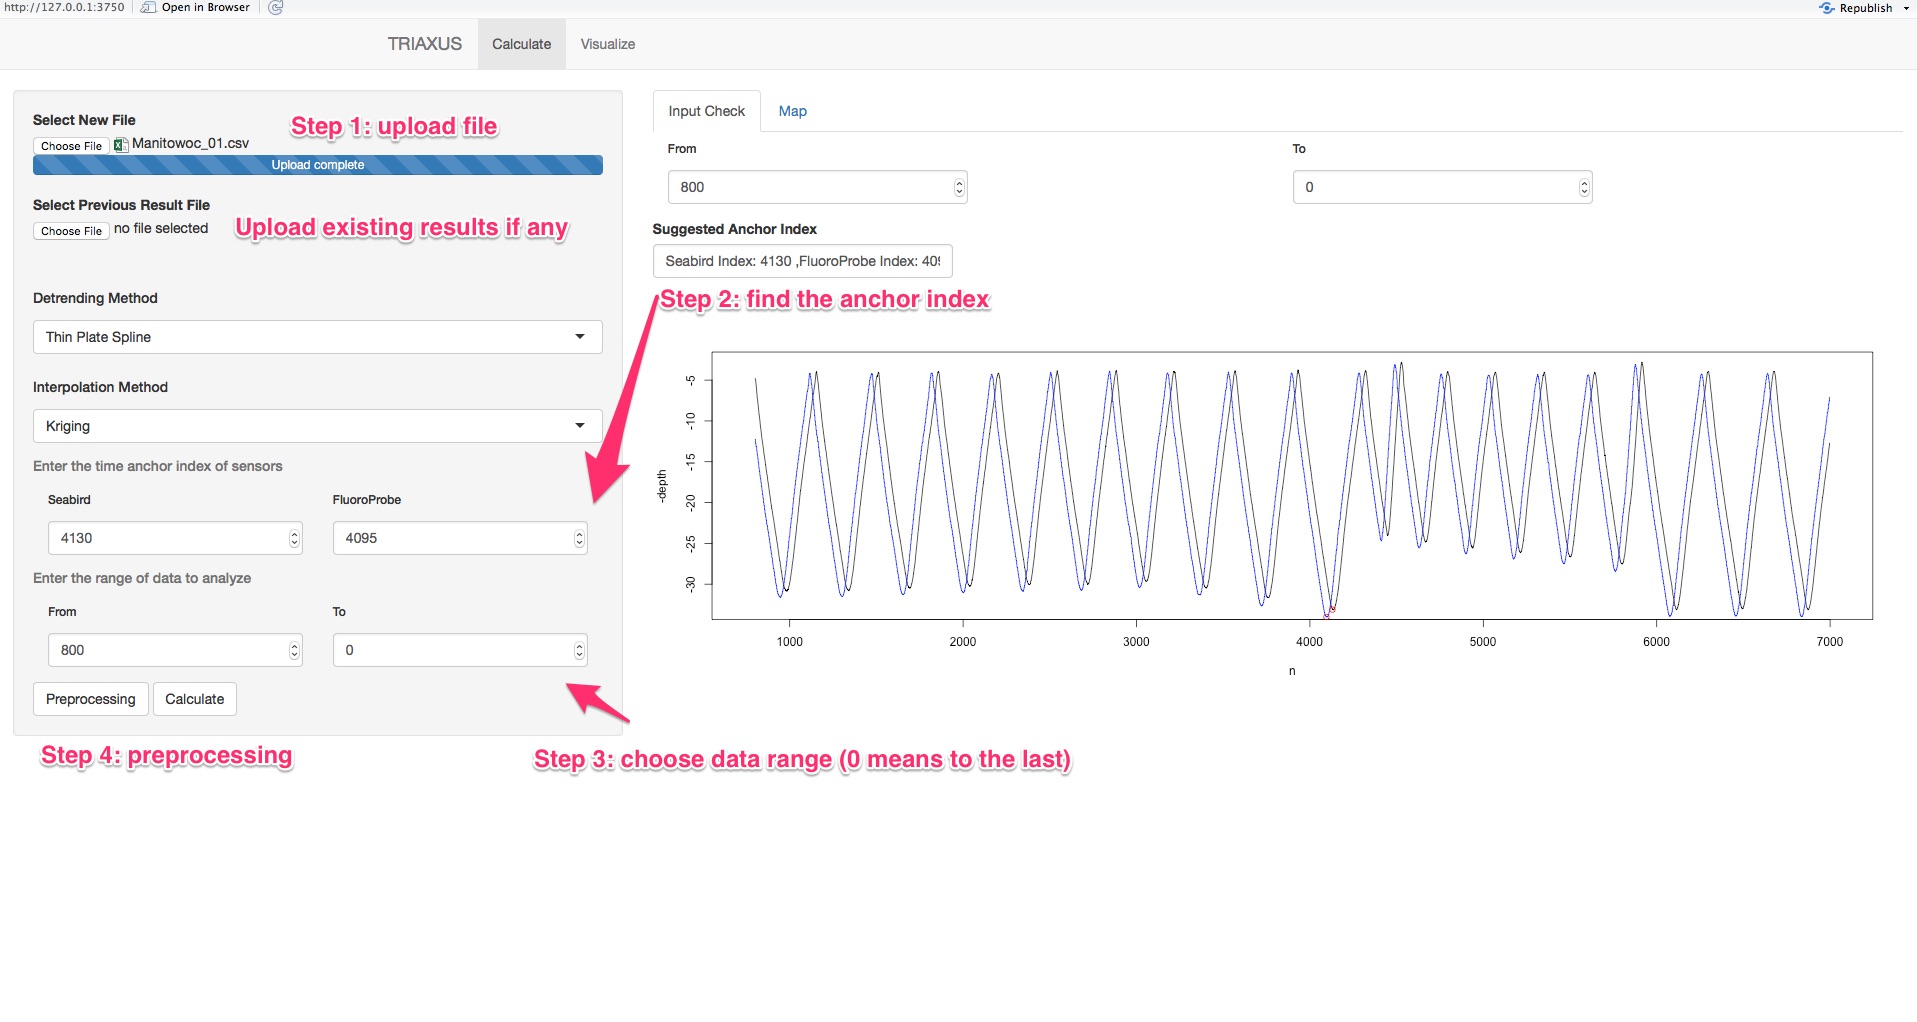
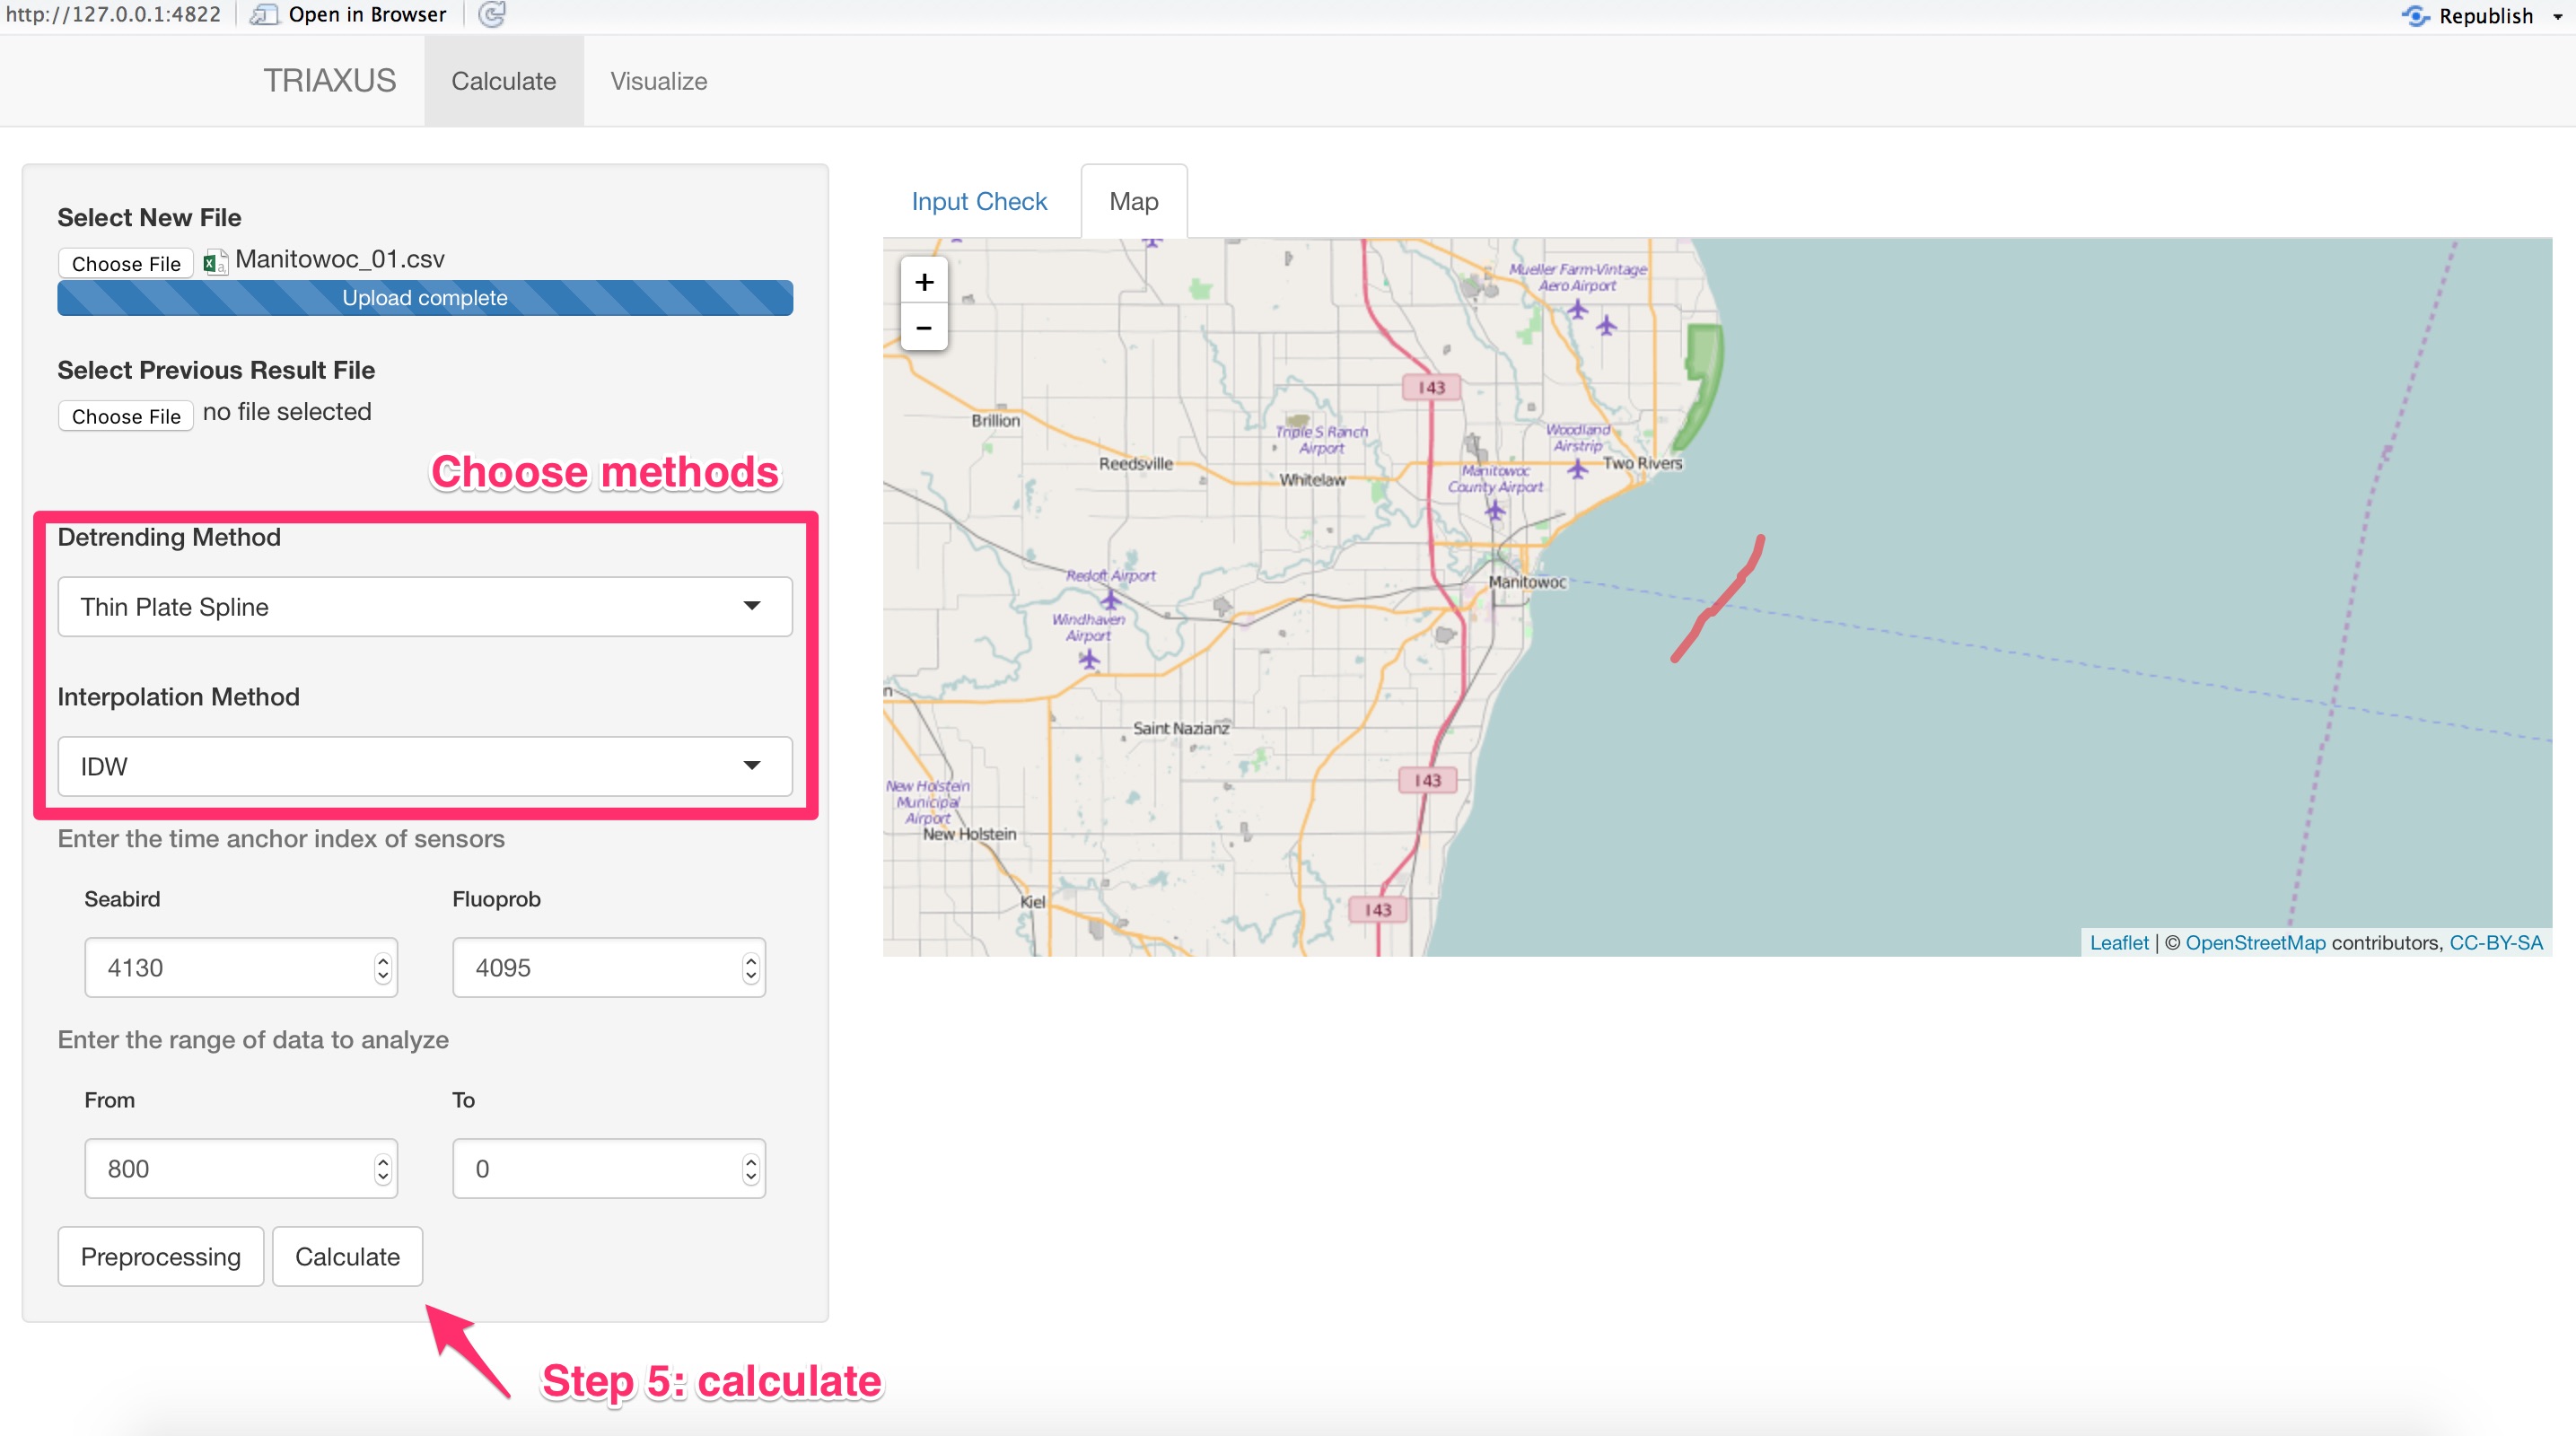
- Step 4: Preprocessing
- Step 5: Calculate
By clicking "Preprocessing", The map panel should pop up to show the path in the map (You may need double click).
After preprocessing, click "Calculate". A notification will pop up on the upper right corner, indicating the status. The results will be saved into your ouputFolder with a name as "allTriaxus_upto_Manitowoc_01.rds". This is a file storing an R object that contains the raw data, cleaned data and interpolation results. This is also the file that should be uploaded in step 1 if you choose to continue analyzing "Manitowoc_02.csv" so that the results of Manitowoc2 will be combined with Manitowoc1.
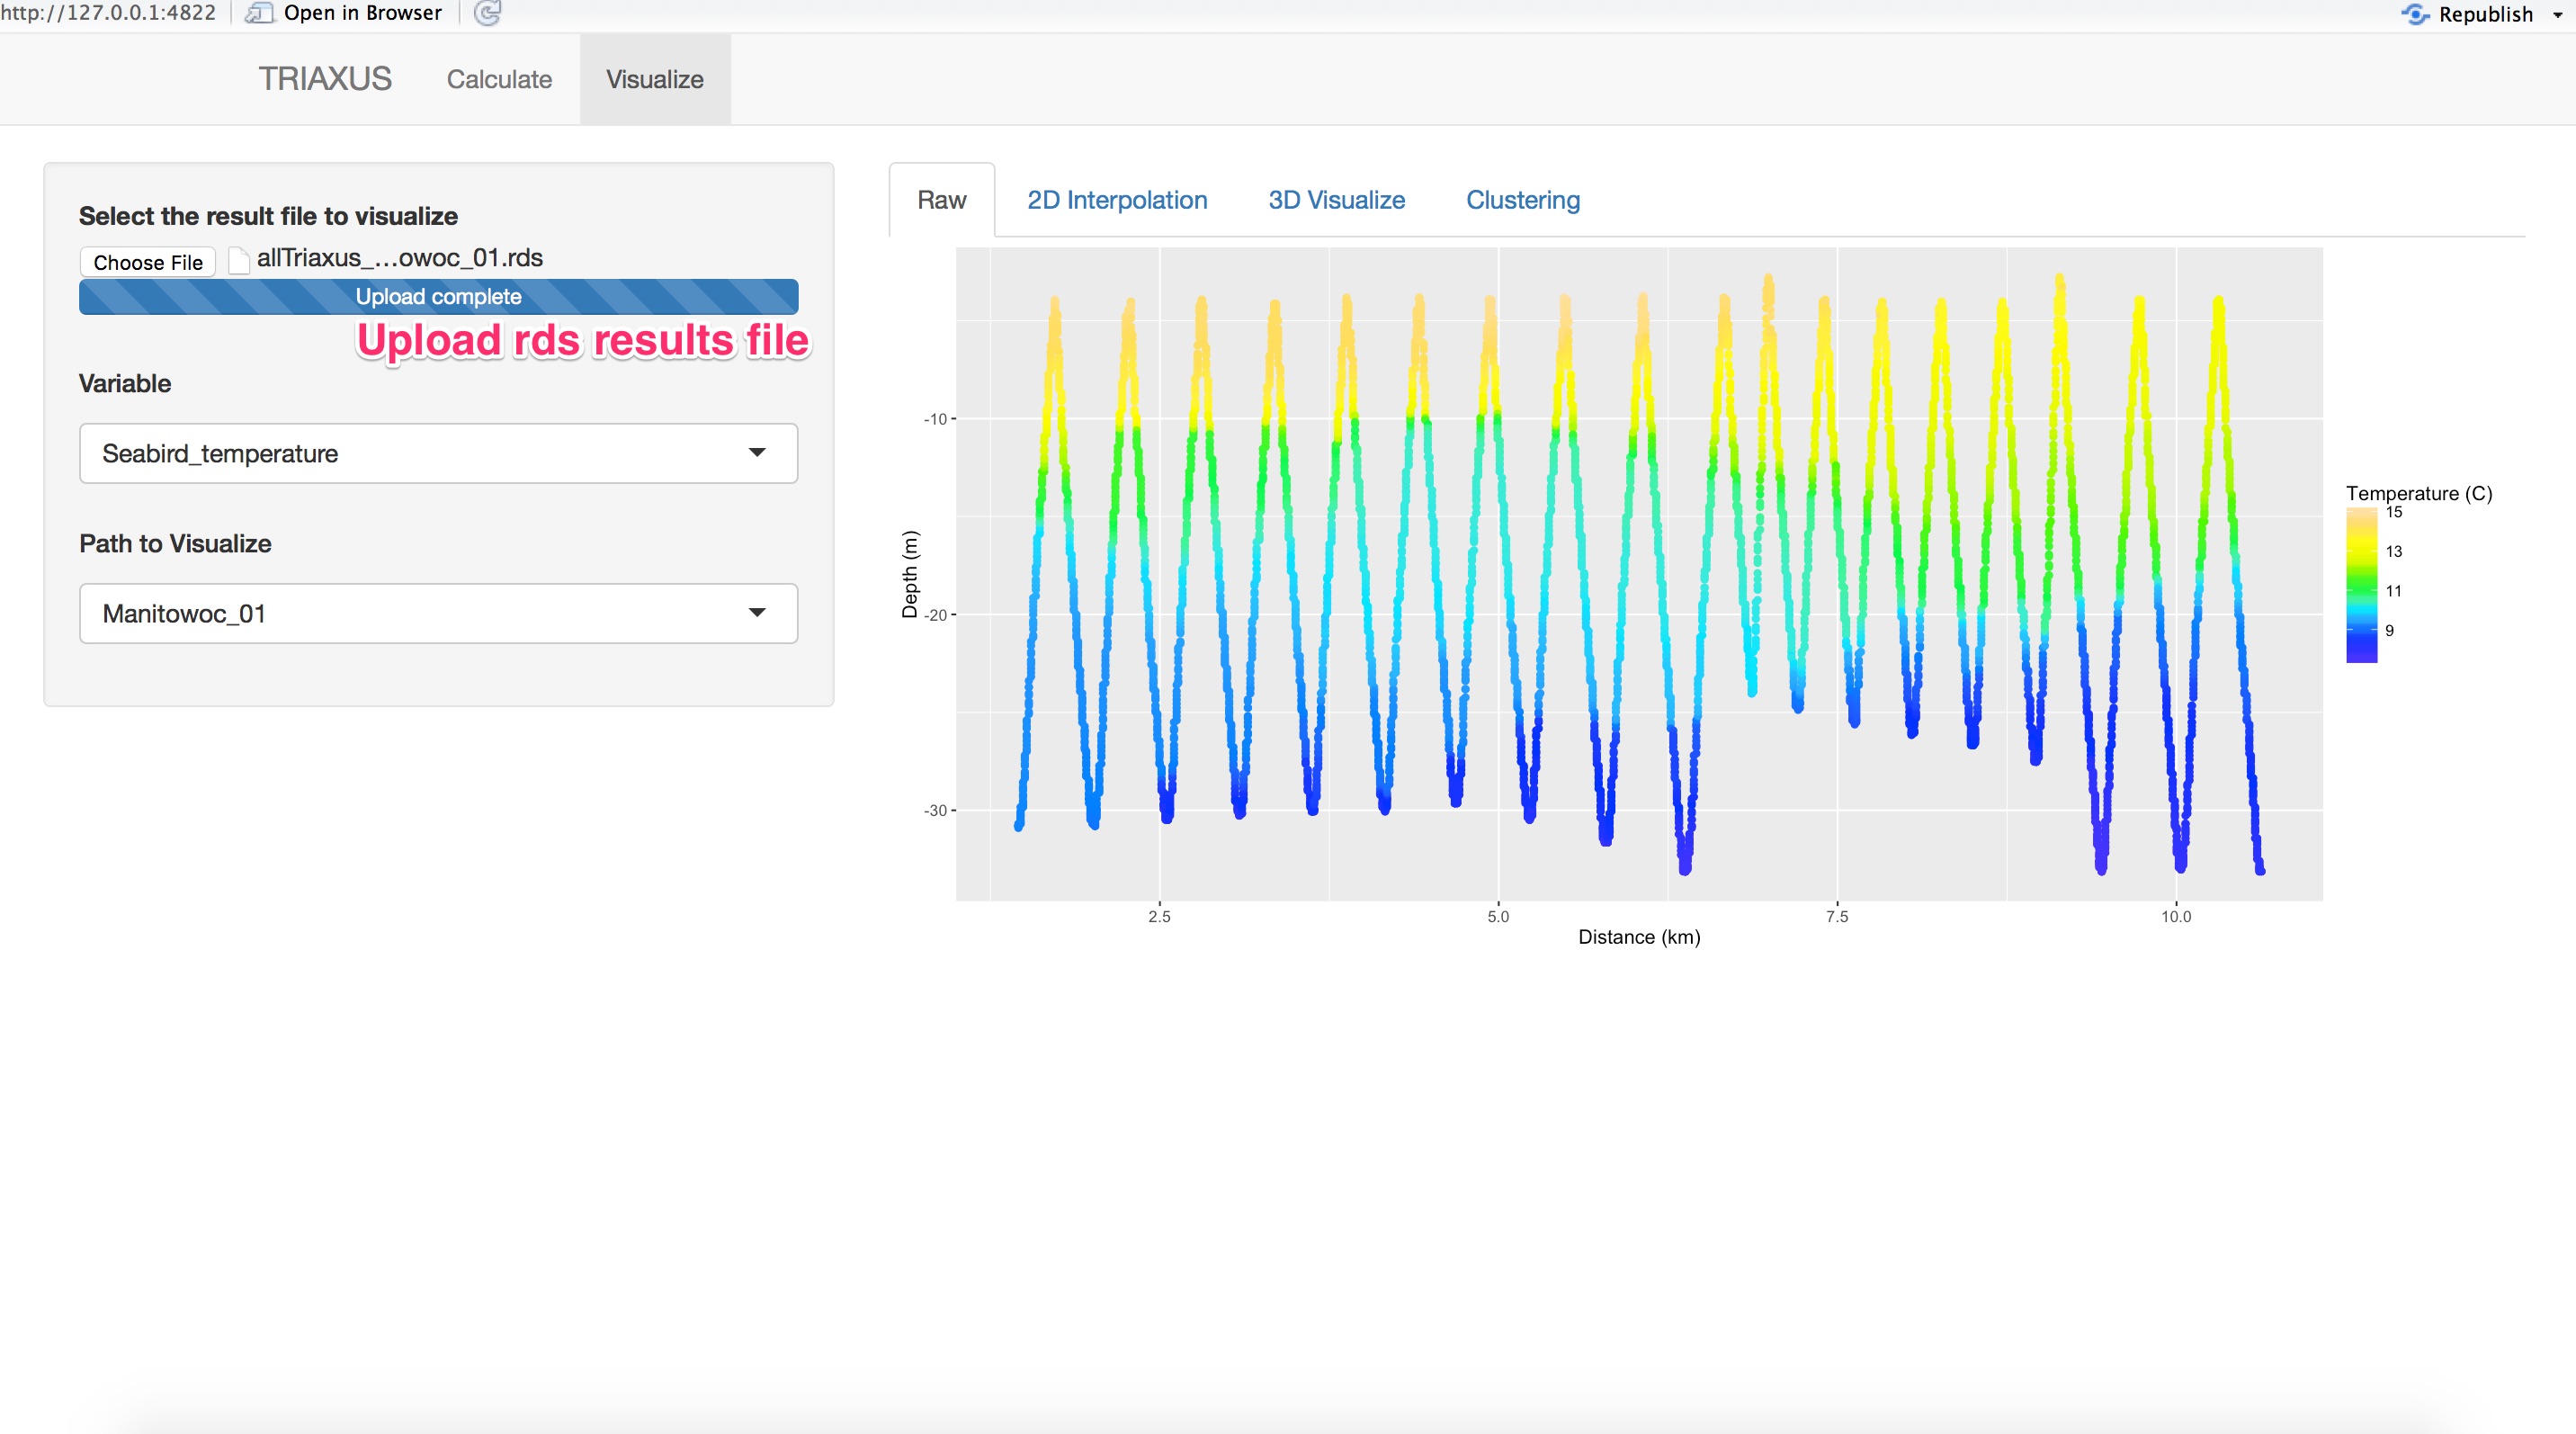
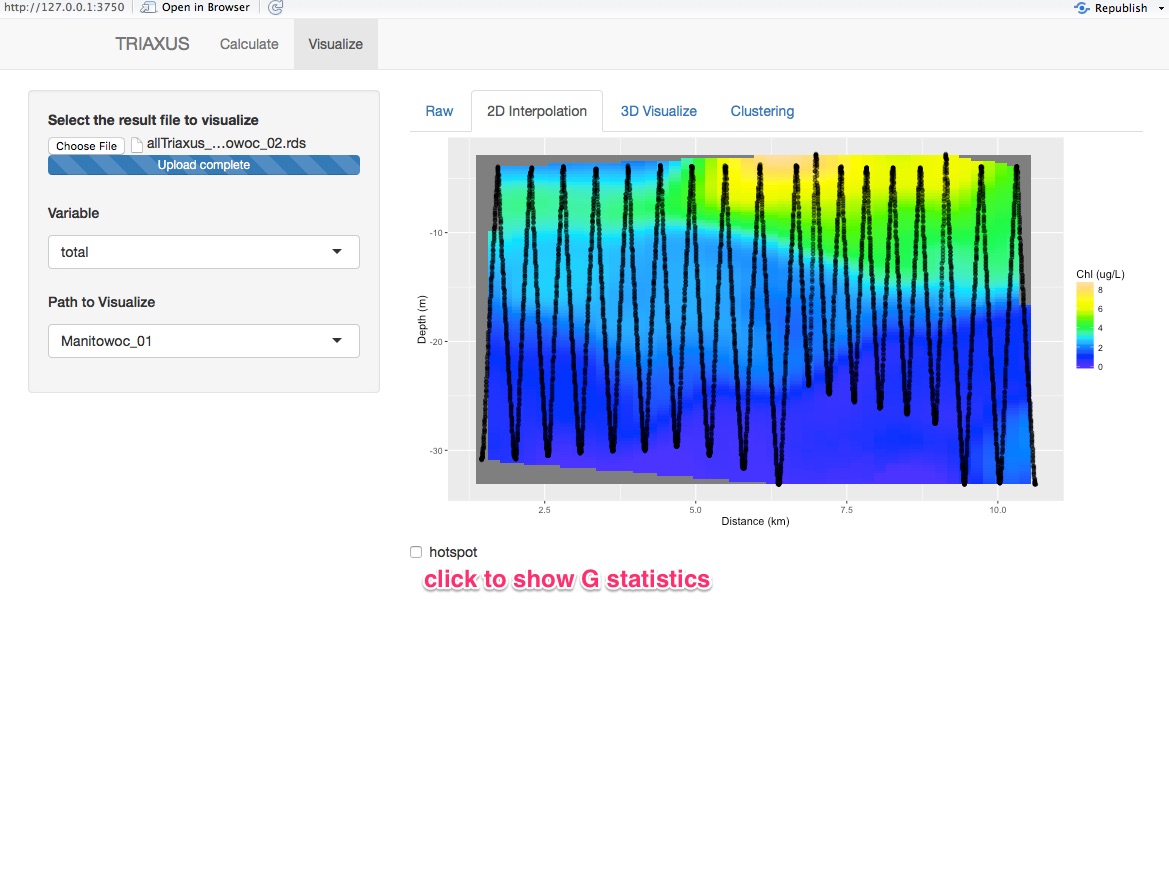
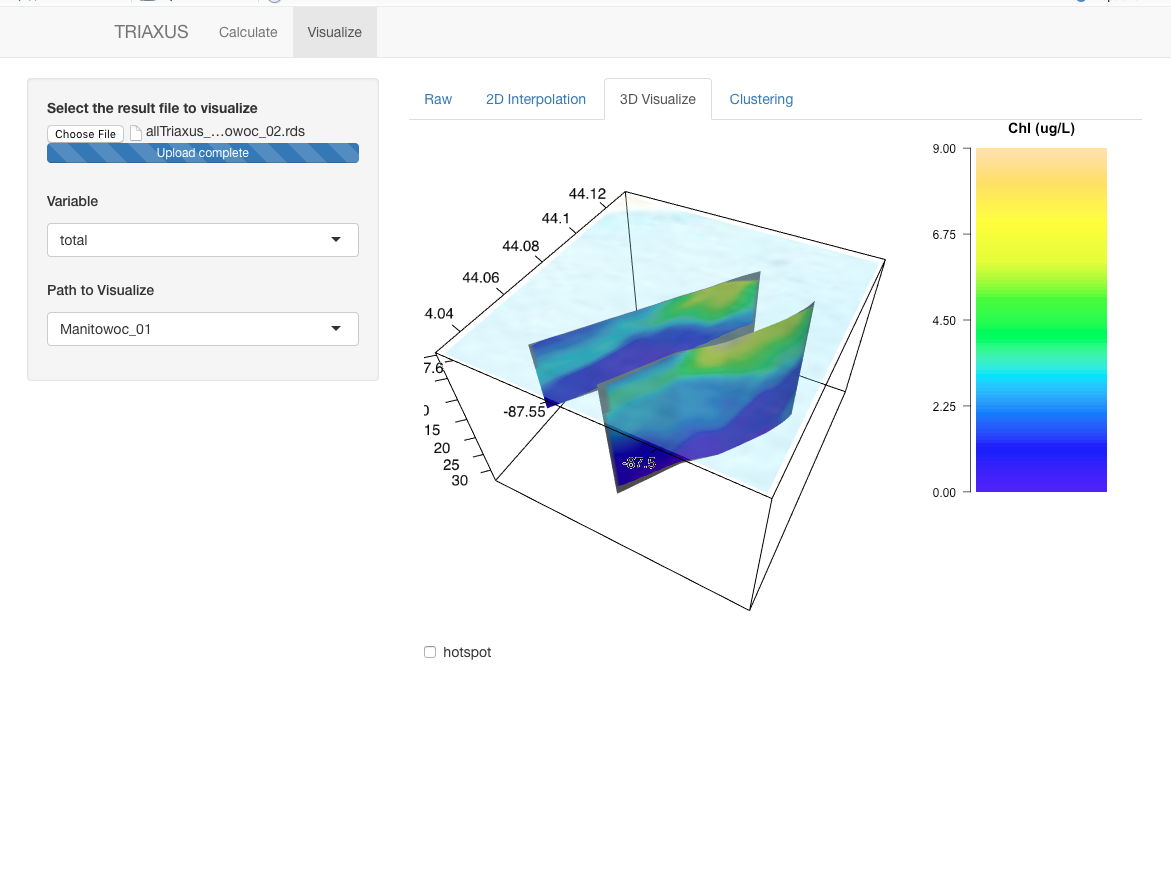
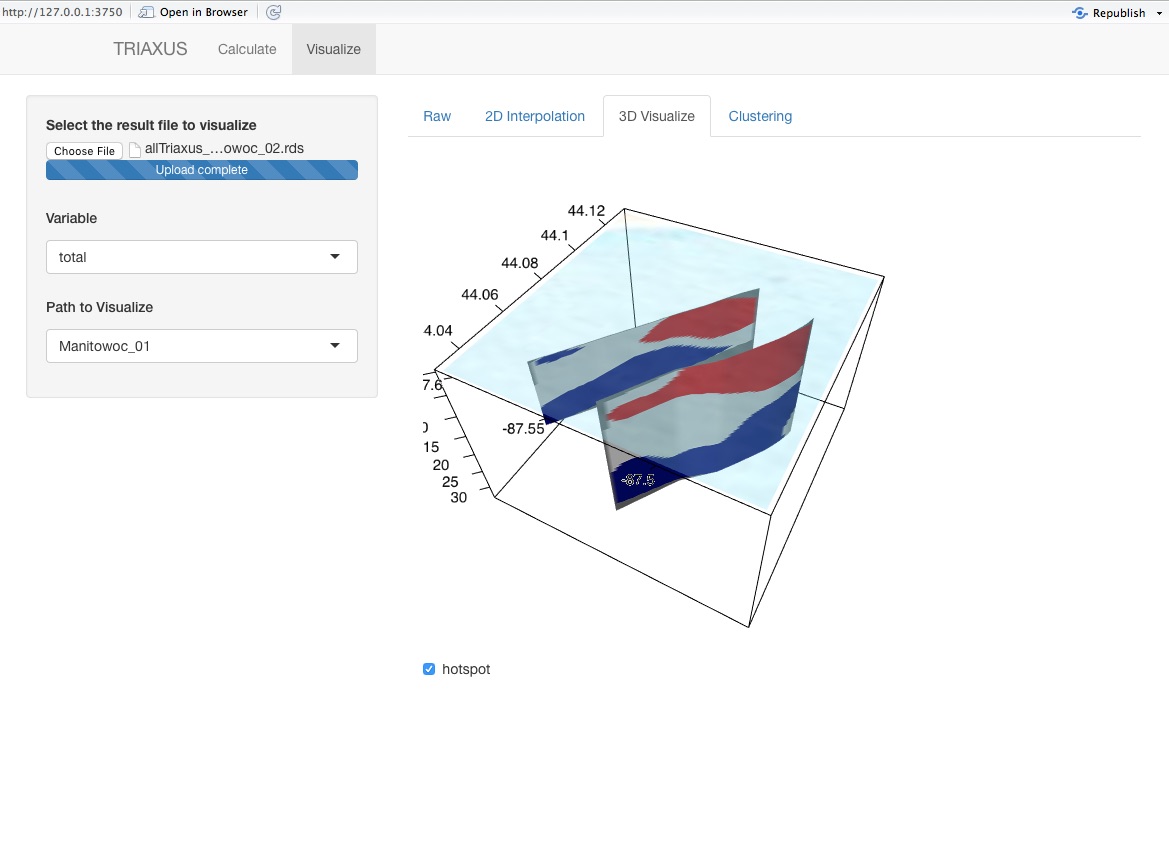
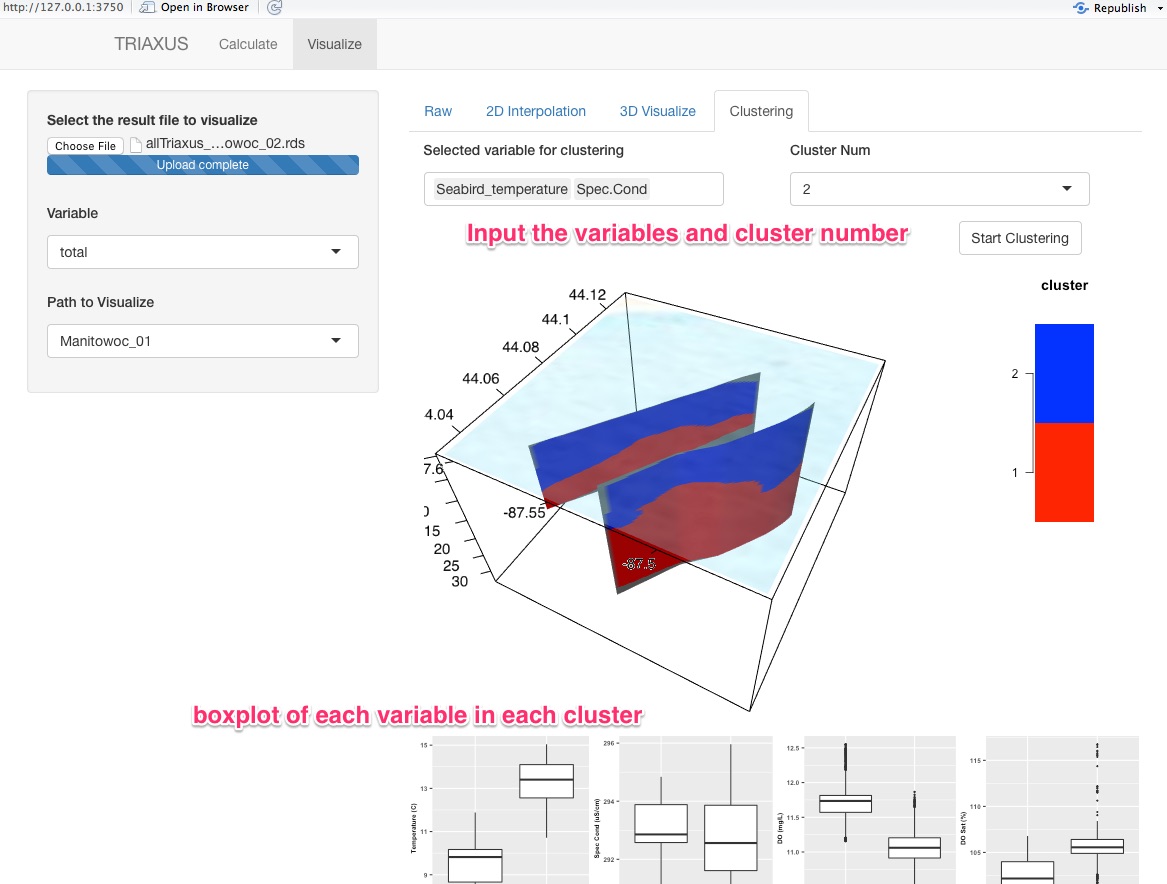
- Step 6: Visualize
Click Visualize Panel, upload the "allTriaxus_upto_XXX.rds" file (e.g xxx may be Manitowoc_01). The program will perform as a visualization tool to visualize the path results contained in "allTriaxus_upto_XXX.rds" file, including raw data visualization, interpolation visualization in 2D and 3D and cluster analysis. The 3D visualization might be slow since R shiny needs to send all plot information to the browser.
Developer
Wenzhao Xu (@stormxuwz), Ph.D in Civil and Environmental Engineering, University of Illinois at Urbana-Champaign